State of Health in Tennessee
Focusing on health and wellness begs the question, “How healthy are we?” Here’s a look at some statistics compiled by the state of Tennessee.
How Do We Compare?

Tennessee is the 44th healthiest state—just six spots from the bottom. (1)
Physical Activity
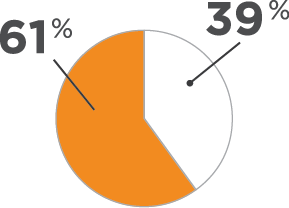
Nearly two-thirds of Tennesseans get less than 2 ½ hours of aerobic physical activity each week. (2)
Physical Activity

Overweight, physically inactive employees can have medical costs as much as 19 percent higher than active employees. (3)
Healthy Eating
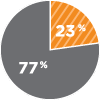
In 2009, only 23 percent of Tennesseans ate at least five servings of fruits and vegetables a day. (4)
Tobacco Use

More than 23 percent of Tennesseans currently smoke, and the national average is 18.4 percent. (5)
Sources:
(1) Gallup-Healthways Well-Being Index®
(2) Behavioral Risk Factor Surveillance System, 2011, CdC
(3) Relationship of Body Mass Index and Physical Activity to Health Care Costs Among employees, May 2004, Journal of Occupational and Environmental Medicine
(4) Surveillance of Certain Health Behaviors and Conditions Among States and Selected Local Areas, 2009, CdC
(5) Behavioral Risk Factor Surveillance System, 2008, CdC